Cooperating With Failure
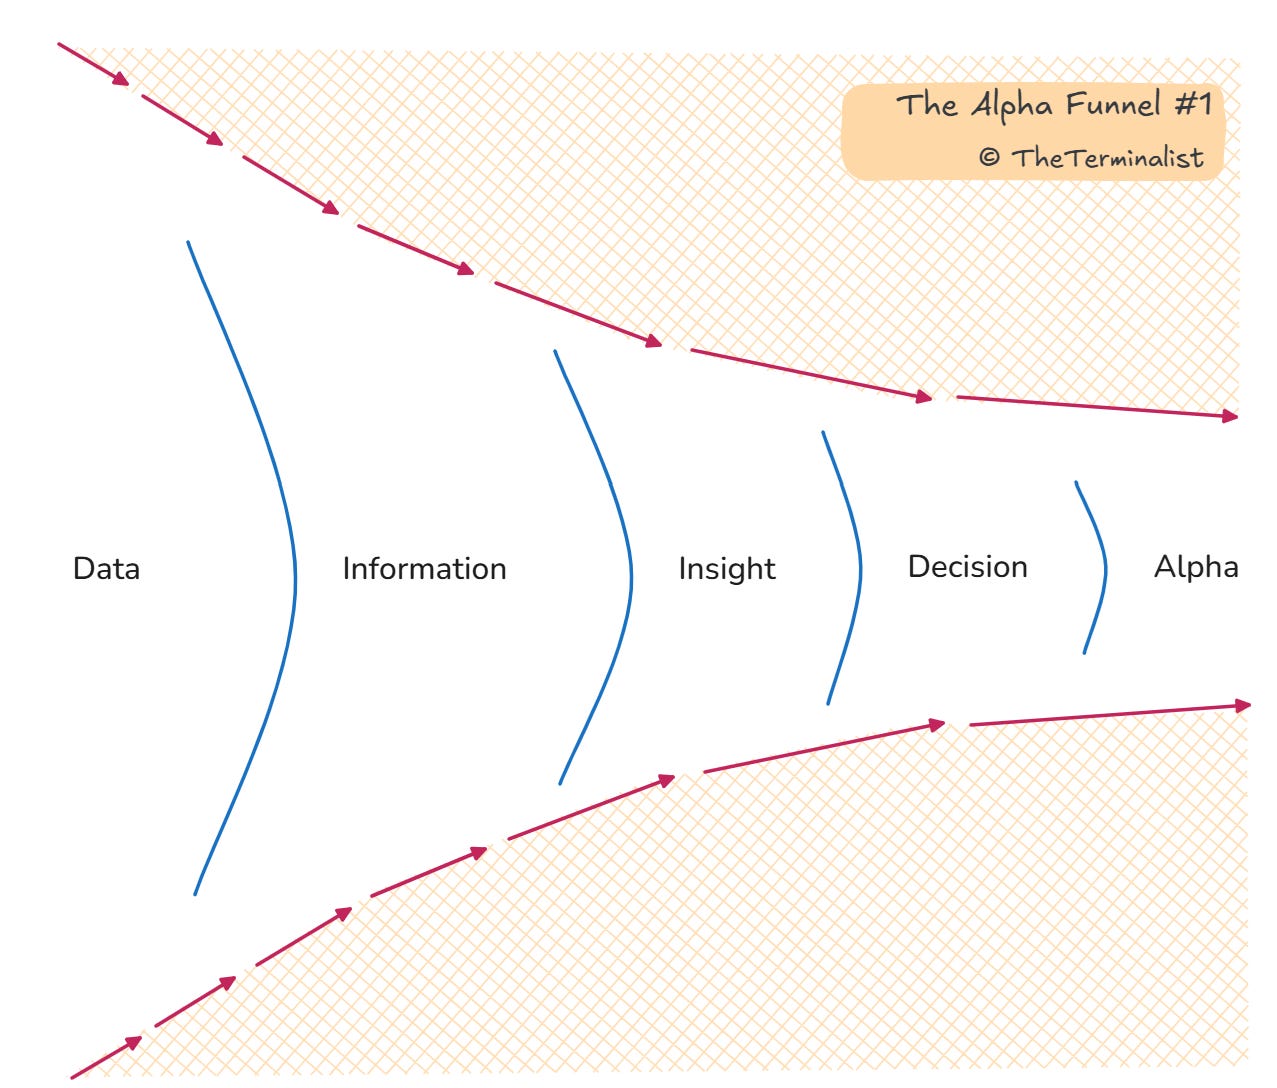
On data trust and a framework for underwriting AI's inevitable failures.

When I was at Placer, I noticed a disconnect between how random folks online (mostly in LinkedIn tHoUgHtLeAdErShIp posts) discussed data products vs. how we talked about data internally. That disconnect manifested most visibly in this simple contrast: “data quality” vs. “data trust.”
Broadly, when people talk about data quality, they are talking about how to value an input. Data quality is generally some combination of precision, accuracy, breadth of coverage, unique or proprietary coverage area, latency/freshness, and possibly some case-specific data cleanliness or formatting needs. This is obviously very important (GIGO). But, to reiterate, data quality is focused on the input.
At Placer, the lion’s share of support tickets – and the ones the company really cared about – were about data trust. i.e. “The report says X and that seems wrong to me.” Someone would investigate and usually conclude that a geofence’s boundary lines were a little bit off or discover evidence that, in fact, the report was correct. (On one memorable occasion, an executive whose company ran a live music venue disputed the data because our report showed foot traffic that vastly exceeded the venue’s capacity. Our team subsequently discovered a mega-famous artist had closed the block and performed an unannounced show from the venue’s rooftop.)
But the company’s attention to data trust was evident in every function and at every step of the customer journey. We never pointed to the raw data’s provenance to prove that Placer reports would be closer to ground truth more consistently than any other vendor; we simply let prospects and customers compare it themselves and then managed expectations appropriately. Data trust is about the output.
And since the best data businesses (and AI businesses – yes, we’ll get to that) often work on behalf of their customers to abstract away the raw data to get to insights, you simply must solve for trust.
What does it mean to solve for trust? It means you must close the gap between the information and insights you generate and a user’s willingness to bet their reputation or their capital on them. For every bit of data a user receives in a business context, they are making an implicit risk assessment of whether the value of the accumulated signal outweighs the potential cost of a wrong decision (or a failure to take action).1
In this sense, people think like investors even if their jobs are far afield from Wall Street.2 Salespeople who blast out barely (or inaccurately) personalized cold emails, supply chain managers who monitor shipping traffic and oil futures markets, all the way to the brewery owner who decides if it’s time to expand their operation and how. Similar intuitions apply.
But because premier data businesses historically catered to sophisticated investors, I believe many of the most experienced and skilled data business operators have a perspective on data trust that is somewhat warped.
Trust Strategies
How do you solve for trust? It depends on what you need to do. In the abstract, I like the following framework, which is driven by two core questions:
Is the data used primarily in the aggregate or is each individual data point meant to inform an action?
How critical is the accuracy of individual data points (and, to some extent, aggregated data points)?
From there, we can draw a simple matrix about data trust with use case granularity on the x-axis and accuracy needs on the y-axis. Each quadrant implies a corresponding “Trust Strategy.”
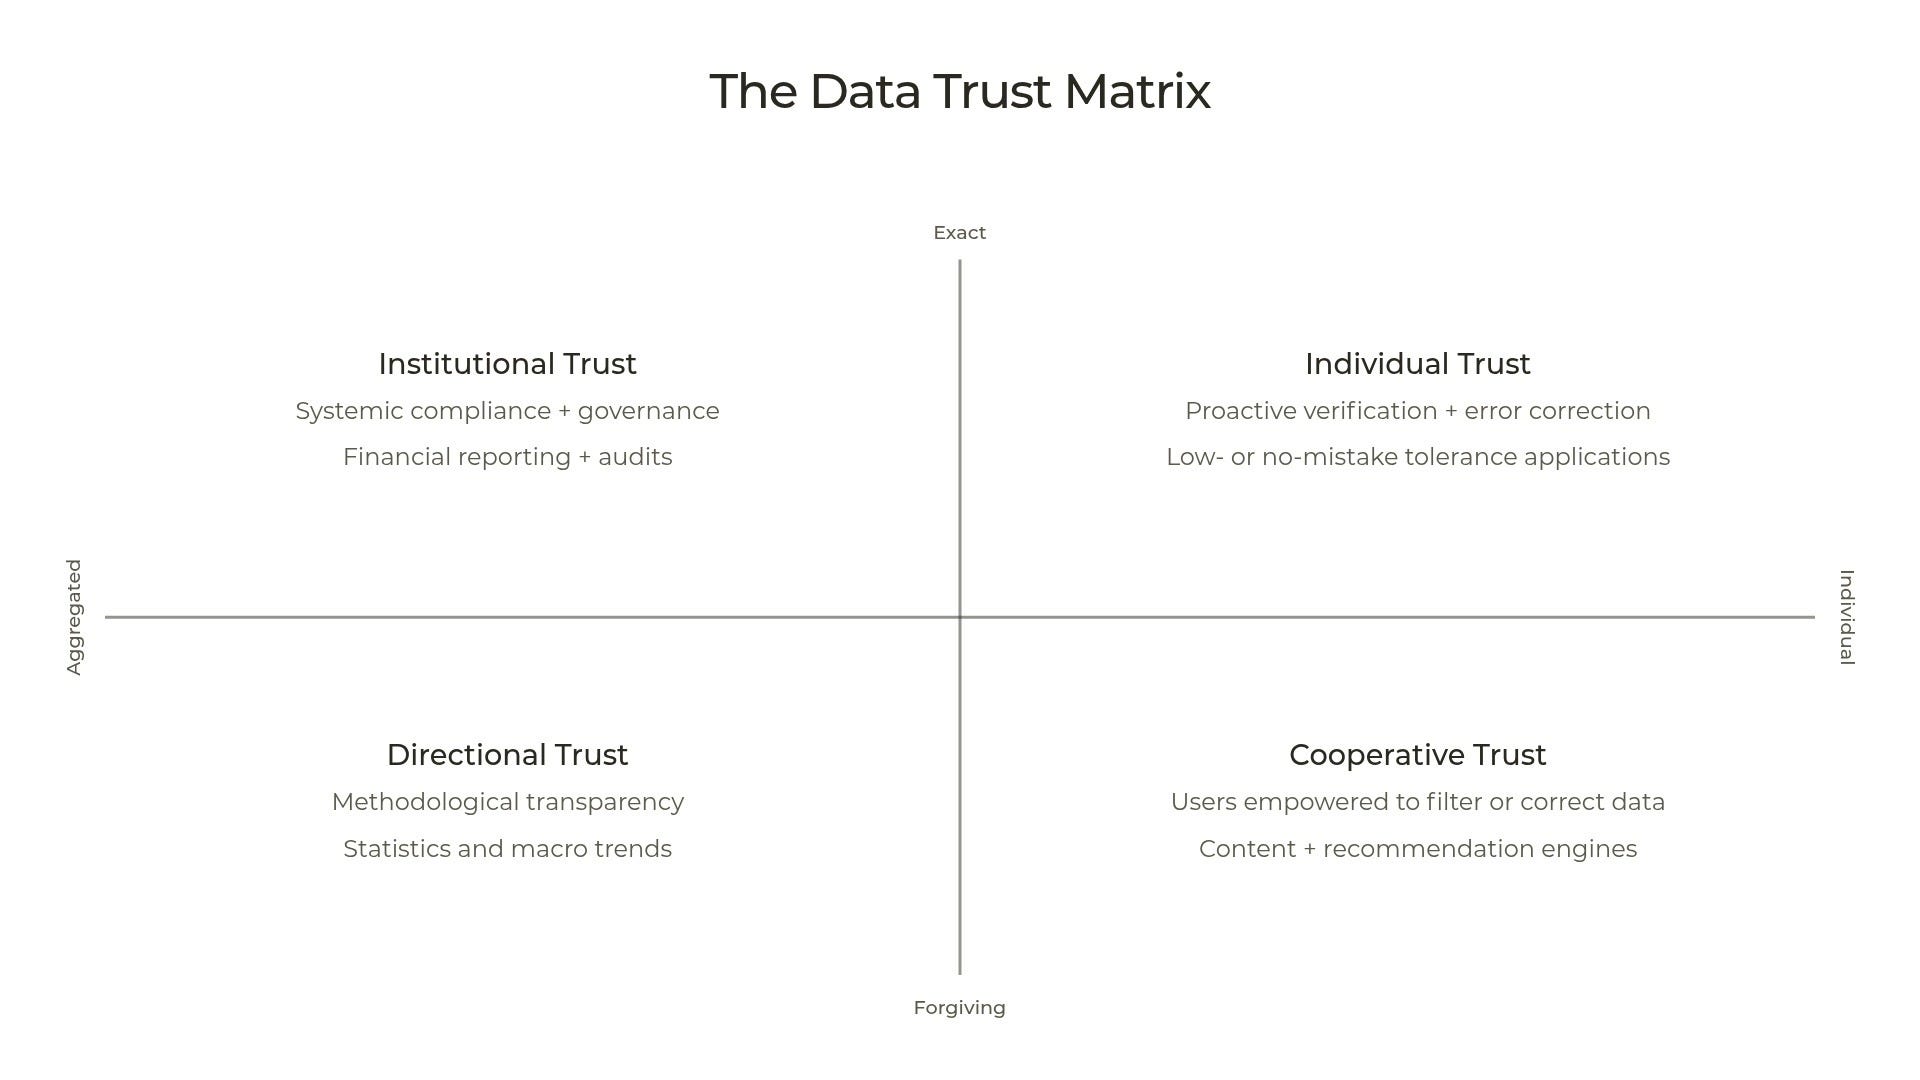
Individual Trust
Accuracy is critical + Individual data points drive actions
In this part of the data universe, data quality and data trust are the same thing. I believe this is the root of that warped perspective I alluded to. If you come from a financial markets and investing background, much of the data you work with would be useless (or worse) if any of the individual data points were inaccurate. There is no gap to be closed and no expectations to manage. If the data is not accurate, it is worse than useless.
Data trust here requires proactive verification at or prior to runtime, rigorous data lineage, and a commitment to zero mistakes.
Institutional Trust
Accuracy is critical + Data primarily consumed in aggregate
This quadrant demands high accuracy on aggregate metrics, often because the data is intended to satisfy compliance and reporting regimes and is sourced from systems of record (financial or otherwise). The macro calculations must be sound and the individual data points must be auditable even if they are not immediately visible.
Institutional data trust requires strict governance and data validation frameworks. You must catch or prevent corruption of underlying data from metastasizing.
Directional Trust
Accuracy needs are forgiving + Data primarily consumed in aggregate
In this quadrant, data is used to track broad trends, build representative benchmarks, or guide strategic direction. Individual data points are largely irrelevant on their own; the value lies entirely in whether the dataset as a whole accurately reflects the broader reality it promises to measure.
Trust in this quadrant is established through a combination of methodological transparency and regular empirical grounding when possible. As long as the boundaries and methods are disclosed, users can accept some margin of error because they expect directional signal instead of absolute accuracy. (Demonstrable honesty and expertise with the underlying data can be ammo for salespeople to attack less scrupulous data providers who promise the moon on a similar product. You come off looking smart and responsible.)
Cooperative Trust
Accuracy needs are forgiving + Individual data points drive actions
Users in this quadrant take action on individual data points but already expect and tolerate a predictable error rate. There is signal, there is noise, and in the best cases the product and user can “cooperate” to handle the noise.
The user gains trust when they are treated as a partner who can filter the data for themselves and seamlessly report errors. This quadrant also has great potential for embedding trust into the business model via outcome-based pricing, where all stakeholders pre-align on what “correct” or “success” looks like.3
To concretize this, let’s consider the following personas and some of the core data they need:
Investment banker: Prices on bonds, equities, commodities, and any other instruments they trade
Action on individual data points, data must be ground truth accurate
Account executive or sales director: Lead lists of prospective customers
Actions on individual data points, but inaccuracies are expected
Market researcher at a retail or CPG company: Consumer spending data
Action on aggregated data, individual data points usually irrelevant as long as dataset as a whole is representative of what it promises to measure
HR leader: Peer company compensation
Action on aggregated data when setting broad comp policies, but occasionally in need of individual accuracy when hiring or retaining a key employee who has a specific offer outside the company
Corporate controller or CFO: Internal financial data
Consumes and reports aggregated data, but must be able to trace every individual dollar
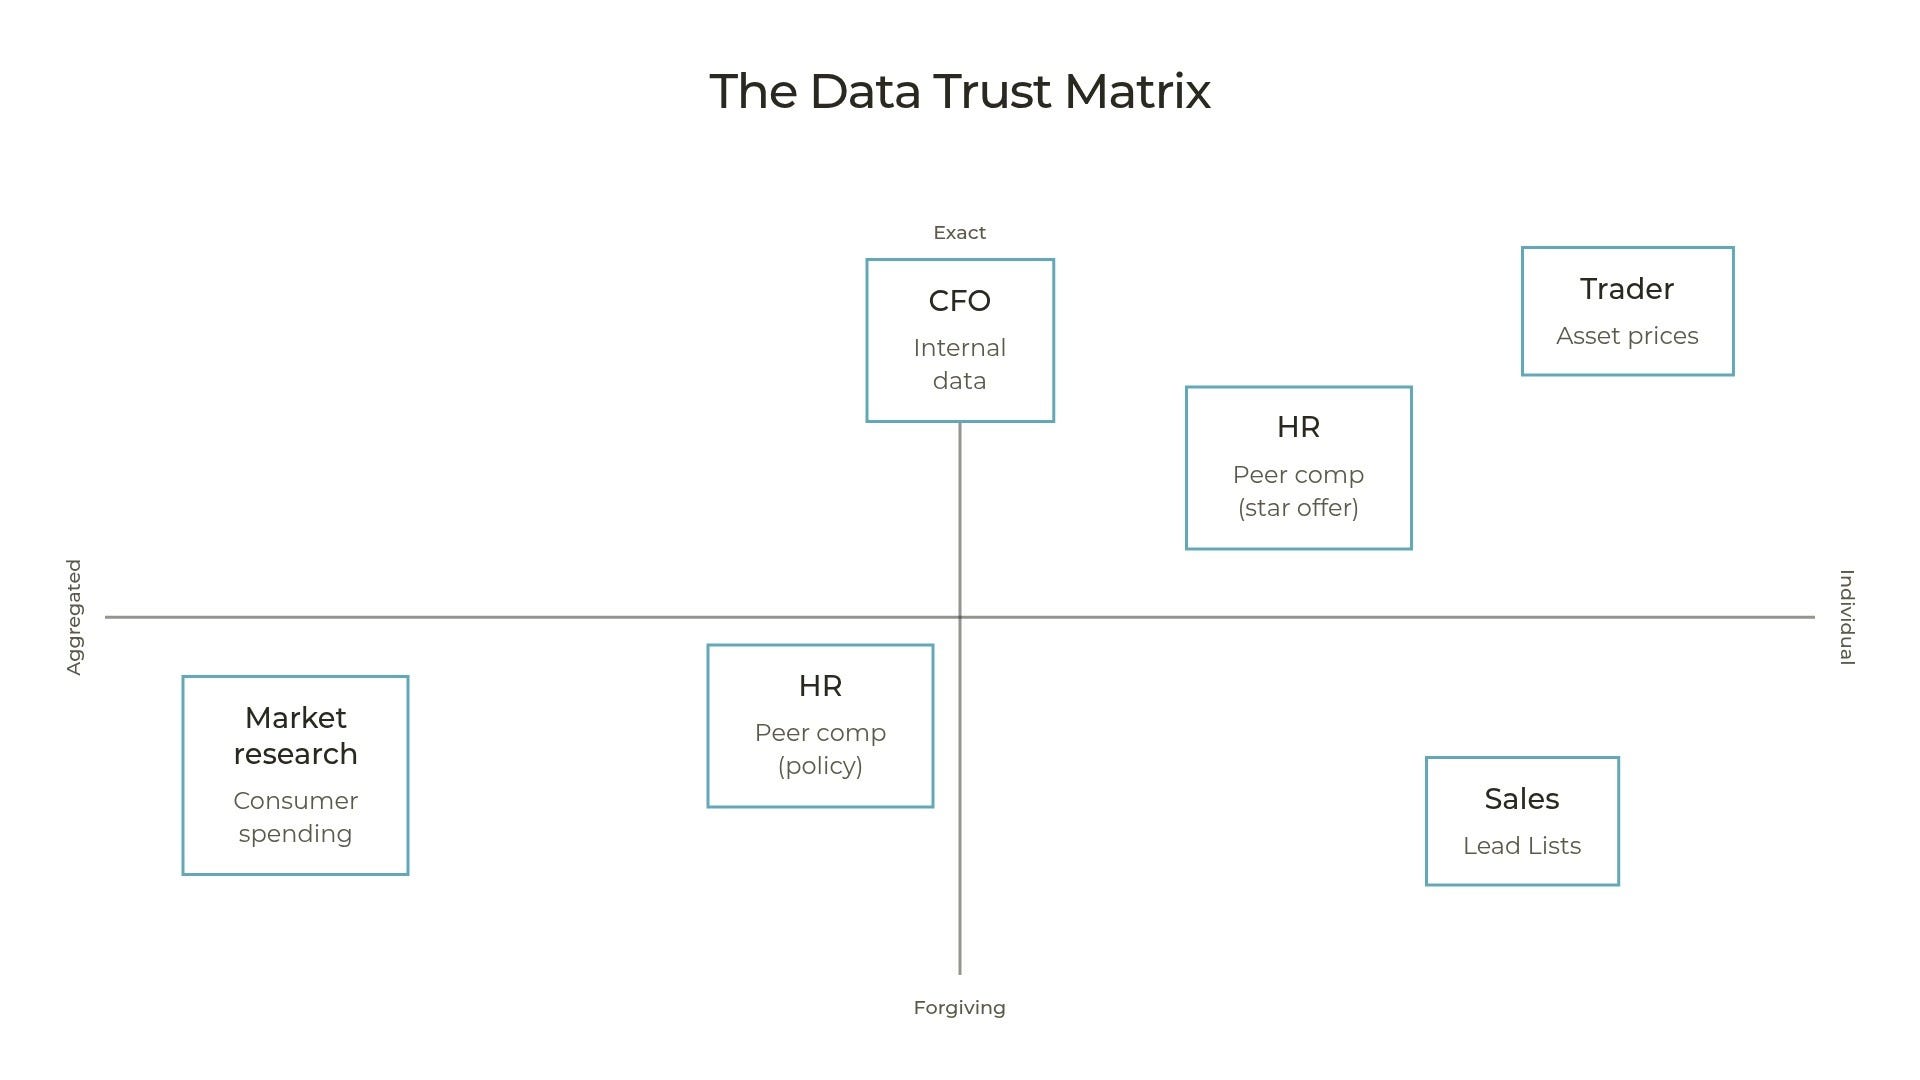
(There are very few use cases that call for aggregated data but require absolute accuracy on granular data points. They are mostly downstream of data collection for applications that require that accuracy. Otherwise you pay extra for accuracy you don’t need.)
To reiterate, most financial data applications have lived in the two upper quadrants of this matrix. But the potential of data applications is so much larger than that and most do not require maximal granular accuracy. That’s where those elements of trust I alluded to earlier come into play. And because this is also where most modern AI products live, I believe this framework — and the corresponding trust strategies — can be applied there too.
Underwriting Failure
When we start evaluating data and AI products that will make mistakes at some rate, there is a third core question that unlocks the classic operations management math that makes data + AI deployments possible at scale: “Can I underwrite this system’s inevitable failures?”
In practice: how often do failures occur, how costly are they on average, how costly are they at the limit, and how early can you tell the difference?
This underwriting is structurally possible because applications that tolerate errors carry built-in risk buffers.
In the Directional Trust quadrant, the buffer is mathematical. The law of large numbers smooths out individual anomalies in the aggregate.
Under Cooperative Trust, the buffer is operational. The product either empowers humans in the loop as quality filters or autonomously learns by training or updating on visible outcomes. In practice, products in this quadrant often assume a very low cost of failure or capped downside. (This is the case for B2B contact providers like ZoomInfo and Apollo, which I touched on in my previous essay about data businesses and the 7 Powers)
Let’s dive deeper with the foundational example of a customer service chatbot:4
# of interactions * % regrettable poor outcome = # of failure cases
# of failure cases * (Mean $ loss - Mean $ cost to remediate + Mean $ recovery value) = Total Expected Loss
If your Total Cost of Ownership of that chatbot deployment + Total Expected Loss is substantially less than it costs to run the status quo support team (or the support team at a predictable level of scale), it is not difficult to underwrite that deployment on the surface.5 Failure is a line item that can be actively managed or absorbed by the efficiency gains of the automation itself.
But let’s consider what edge cases might look beneath the top lines.
Maybe you’ll choose to write off any loss that costs more to remediate than you can recover. Loss is below a certain $ value? Bank error in customer’s favor. Write it off, go on with life. But what if the number of small losses ticks up or starts to look like a coordinated fraud against you? You may need to add expensive verification processes into your support workflow. Your TCO just went up.
How large of an initial loss is too large to risk? And how do you decide how much money to budget for remediation or recovery on a single large or high-profile loss? How confident are you in recovery?
What if, in your business, larger losses are harder to remediate and recover than small or mid-range losses? If the statistical distribution of failures and losses does not align with the distribution of remediations and recoveries, the economics of that deployment can come unglued very quickly.
Given some clear boundaries, a modern autonomous system needs to reliably detect when something is going wrong. Can it tell the difference between a small problem and a true tail-risk event? Can it be architected so that small errors do not compound?
When You Ship To The Wrong Quadrant
If you scrolled back up to the Trust Matrix, in which quadrant would you place inventory and supply chain management?
In September 2025, Starbucks rolled out a wide deployment of automated retail inventory management technology. They touted 99% accuracy at 10x the speed of manual counts, which they claimed were 80-85% accurate. Not even nine months later, they shelved the technology and went back to manual counts:
[T]he work landed back on the people it was supposed to free. Baristas re-counted by hand to fix the AI’s tallies, which means the system didn’t replace the task. It added a second one on top of it. A tool that needs a human to verify every output doesn’t deliver efficiency. It delivers two jobs.
The misses weren’t cosmetic either. Over-count a product and the store wouldn’t get enough of what it was running low on. Under-count it and the same thing happened from the other direction. Product availability is the exact problem the tool was bought to solve, and it was making that problem worse.
The full article details how the system failed in practice, but I want to highlight the structural mistake: Starbucks shipped a Cooperative Trust product for a use case that needed Institutional Trust.
At the corporate level, inventory data is primarily viewed in the aggregate (even though people are employed to manage it at more granular levels). At the store level, accuracy is paramount, and inventory mistakes compound. For this use case, an AI product that promised 99% accuracy and delivered materially worse had the potential for catastrophe. Give those mistakes a long enough runway to compound and you risk a version of the infamous bullwhip effect.
We Are Swimming In False Precision
If a computer can reliably and conclusively check the work and issue a binary pass/fail on it, you can model it like an industrial process. The accuracy, consistency, and predictability of those checks will dictate when that process becomes viable.
That is especially relevant when that pass/fail is derived from a probabilistic model, not a deterministic tool. And that is why accurately understanding the capabilities of these products is so important.
I have picked this essay topic up and put it down for well over a year. I was already noodling on it when Benedict Evans wrote “The Deep Research problem.” Kushal Chakrabarti built some important scaffolding to write “The 9s of AI Reliability.”
But the thing that finally got me to sit down and type all this out was the Odd Lots interview with two leaders from METR, which is most well-known for their widely cited visualization of frontier AI model progress (specifically their capability to automate complex, multi-step tasks over long time horizons): the Time Horizon graph.
What jumped out to me in that interview was this pair of observations (acknowledged by the subjects):
Capital allocators are relying on the graph to underwrite hundreds of billions of dollars in infrastructure investments, which is not the activity the graph was built for.
The measurements represented on the graph are getting MUCH less precise over time with no clear path to reversing that.
This becomes easier to visualize when you shift the graph from log to linear scale. Look at those error bars! How do you ops math your way around that?
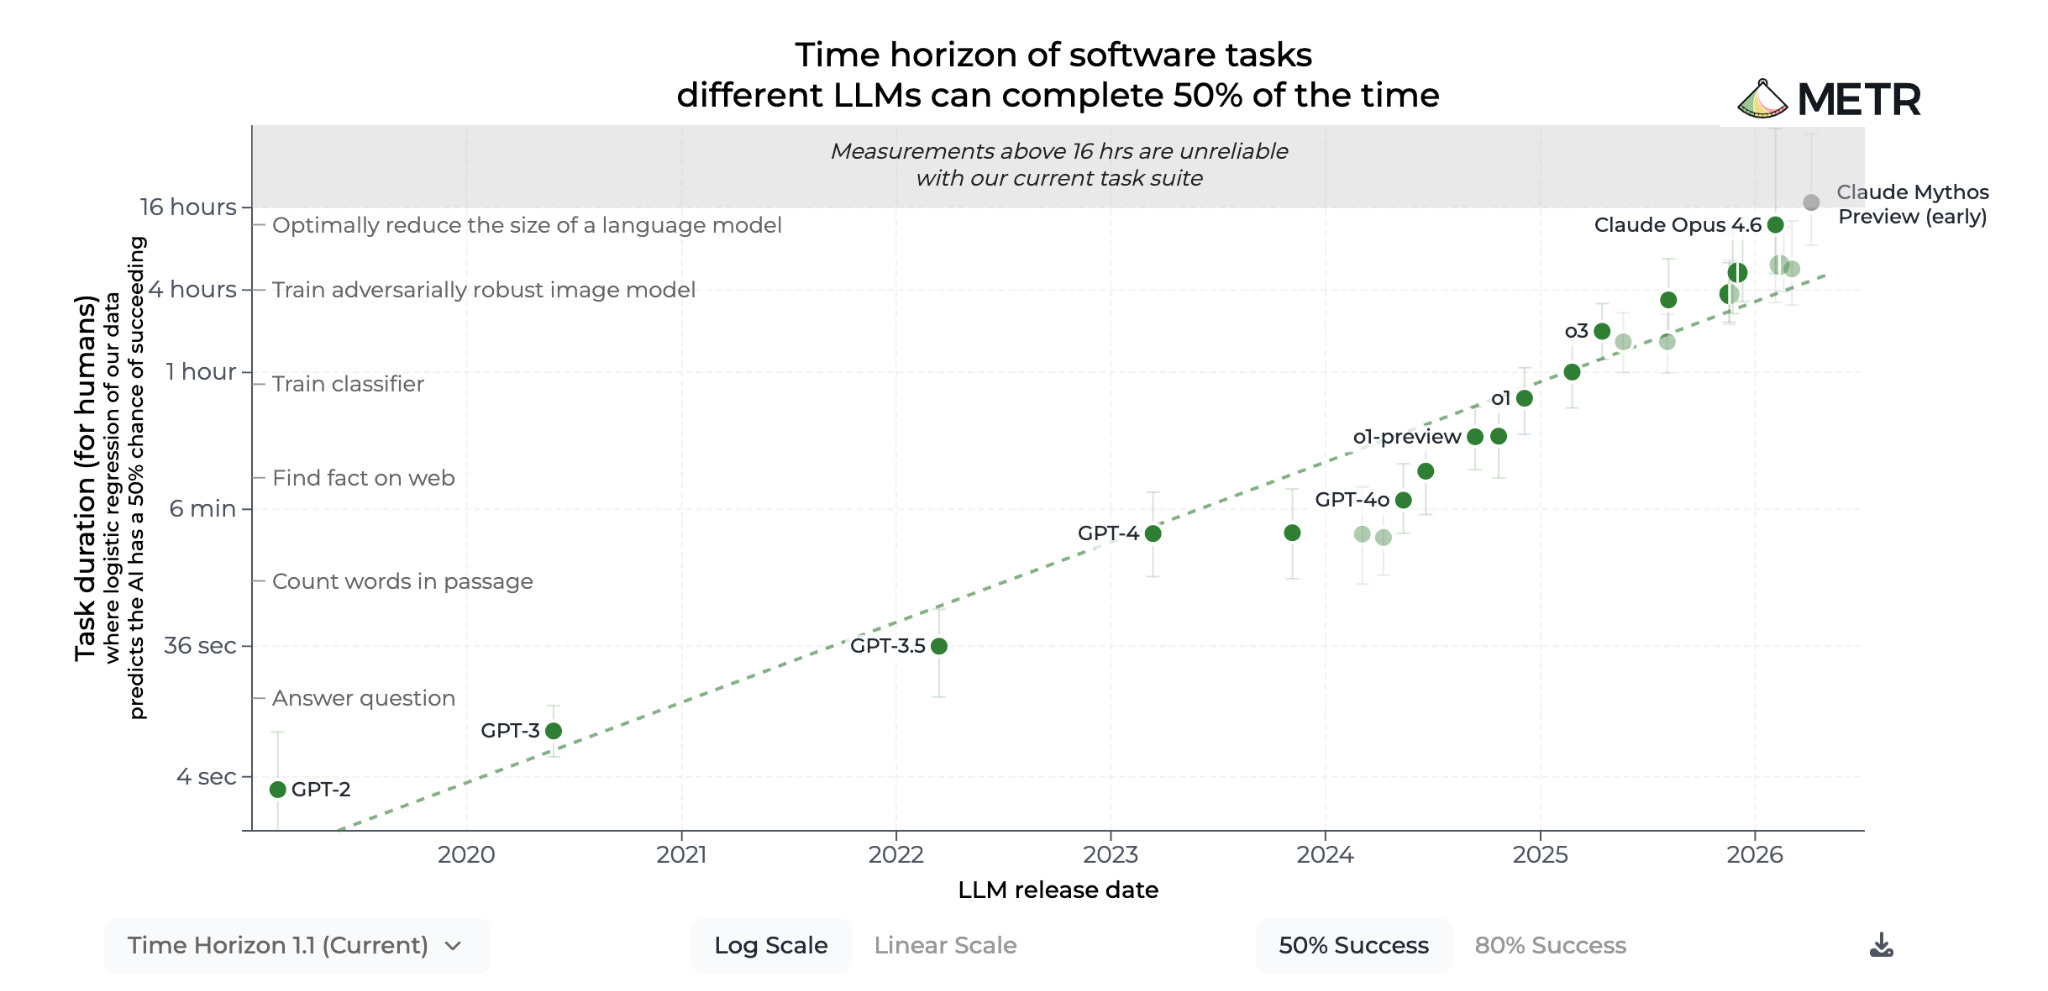
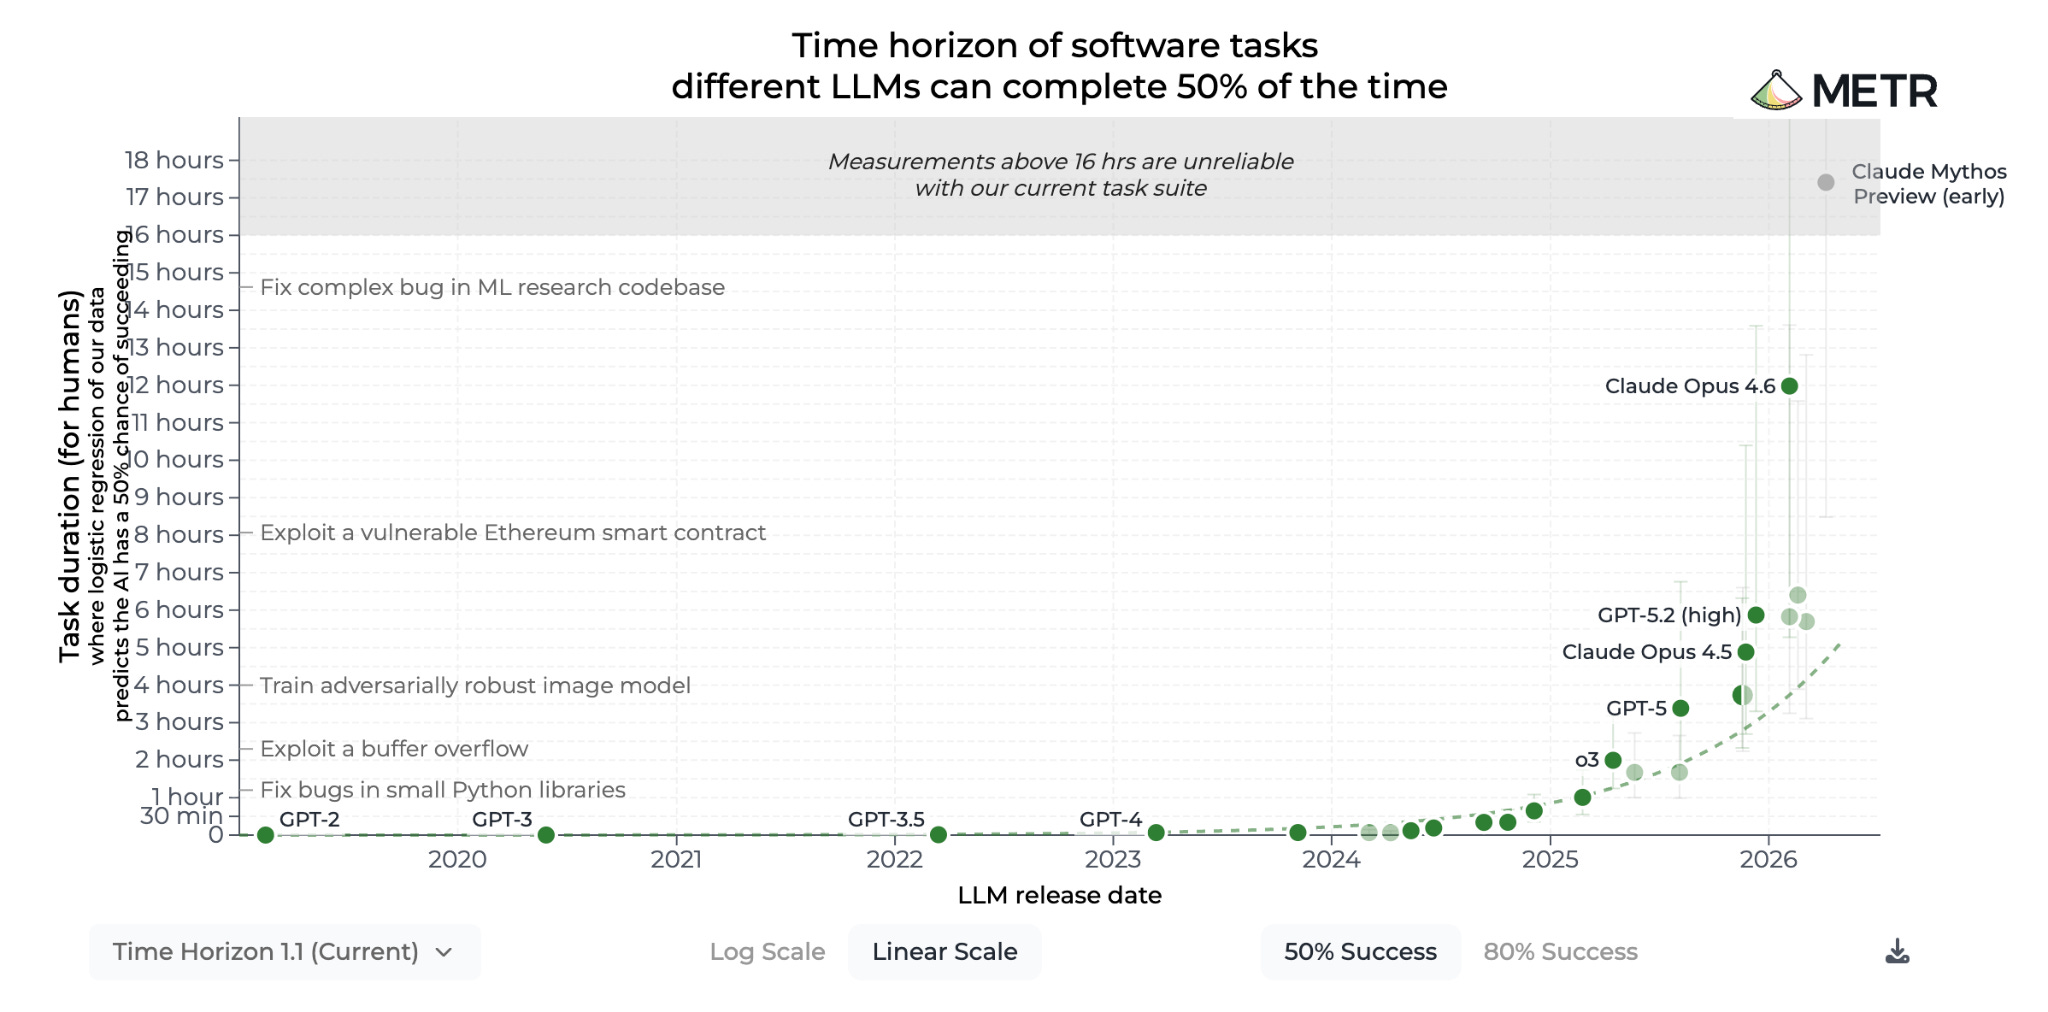
The METR Time Horizon graph was built to track a trend directionally and in the aggregate. It was not built for precision. Yet, given the choices made in its presentation, you could be forgiven for forgetting that.
The y-axis measurement in discrete blocks of hours, the compression of a suite of measurements to a single data point for each model, the default success rate hurdles, and even the choice to color the error bars a barely visible light gray or green all promote a false sense of precision. That nuance gets lost the moment the discussion leaves the visible caveats and enters our oral discourse about AI.
This is why I wrote this essay: to suggest a qualitative framework for assessing when and how it’s appropriate to use data and AI at scale. Broadly, folks need to be comfortable making decisions on what to automate and not automate based on whether their particular social and economic circumstances are compatible with modern technology. Products built for directional accuracy cannot simply be dropped into environments that require exact accuracy and precision. Use cases with massive tail risks need to be considered differently and deployed against far more cautiously than those without.
And most importantly: Because the vast majority of AI deployments will be in that zone where “quality” and “trust” diverge, trust needs to be a first-order concern.
One Last Thought
People generally know how to trust other people. That trust may be messy, provisional, contextual, and constantly recalibrated. But over thousands of years we have collectively developed norms and methods that discipline and shape trust between humans. Breaking trust with someone else has consequences.
My erstwhile newsletter co-author Halle Kaplan-Allen, in her characteristic way, recently framed this missing piece as accountability:
While AI curation optimizes for engagement, or relevance, or some proxy, human curation optimizes for “I would feel weird if I sent you somewhere bad.” Those are different functions, and the second one is hard to replicate because it requires the curator to be accountable to me in a way an algorithm structurally can’t be.
The big question for AI implementations is whether we can successfully learn to trust a new entity that is immune to human consequences. And if not, whether we can collectively agree on where to locate that accountability.
A topic for another essay.
The Terminalist has a fun essay that walks through how raw data is converted into successful investments. Data trust is essentially about getting customers comfortable making decisions based on your product.
In this essay, I will be generous and assume most people are reasonably good and rational investors of their own time and energy.
This is pretty rare in classic data businesses but is probably going to become more popular among AI-driven companies, especially where usage is tied to discrete, individual events e.g. a closed support ticket or a qualified sales lead in pipeline. Fin (formerly Intercom) was one of the earliest to this. Sierra also does this.
The implementation details aren’t relevant to this argument but you might imagine “regrettable poor outcome” to include complete interactions that caused poor outcomes and interactions that couldn’t be resolved but were properly handed off to a person in the moment. You could separate those when modeling this out but the strategic math may not change very much. To the extent it does, it would likely bifurcate outcomes within “loss” and “recovery value.”
Dollar denominations are here as a universal economic substrate. In this toy example, those figures might be measured via changes in e.g. customer churn or cart abandonment